
Architecture as Code: Essential Tools and Techniques for Developers
Architecture as Code: Essential Tools and Techniques for Developers
Architecture is a code. It’s a pure code, derived from the dimensions of nature.
Santiago Calatrava

Table Of Content
- Introduction
- The Benefits of Architecture as Code
- Key Principles of Diagrams as Code
- Popular Tools for Architecture as Code
- Tool Comparison
- Real-World Use Cases
- Making a conclusion
Introduction
Architecture as Code (AasC) aims at describing and arranging software architecture in a human and machine readable and version-controlled codebase, calling for a healthy understanding, efficient development, and simple evolution of complex software architectures.
This repository contains the Common Architecture Language Model (CALM) Specification, and work-in-progress capabilities to utilize the specification. This page provides documentation of the domains and work-in-progress capabilities by the official AasC community.
Whereas others may build their own capabilities independently of the AasC monorepo, we encourage you to be part of the community and expose your projects to the AasC monorepo that benefits from being exposed to the whole community; therefore, attracting contributions and ensuring changes to the manifest will be actively built against your project.
The Benefits of Architecture as Code
Architecture-as-Code is under major construction at the moment, including this documentation. We’re doing a major design and implementation overhaul to address 3 primary objectives:
- Adoptability / Approachability — If AasC is going to provide any value, the intended stakeholders must be willing to use it and get value from it.
- Extensibility — The domains we are addressing are advanced and require tailoring of any solution. Ensure AasC provides an extension-friendly solution.
- Productivity / Efficiency — Embrace the DevOps idea of Flow by providing core automation to bridge MBSE and product development / delivery.
Key Principles of Diagrams as Code
“Diagrams as Code” is more than the act of drawing boxes and arrows. It is taking software development principles — versioning, automation, and reproducibility — and applying them to system visualizations. These ideas can make diagrams a part of your development workflow, instead of being left on a whiteboard.
Let us cover the core principles that make diagrams as code such an effective approach.
1-) Text-Based Definition
At the heart of diagrams as code is the use of text files to define diagrams. Instead of dragging shapes in a GUI, you describe relationships and components using a domain-specific language (DSL) or programming code.
Why It Matters:
- Text files are easier to version, diff, and track in Git.
- Enables peer reviews and collaborative editing via pull requests.
- Developers are already comfortable working in text-based formats.
2-) Reproducibility
“Code is repeatable” — and so must your diagrams be. Diagrams as code let you reproduce views whenever, wherever, without relying on manual styling or external documents.
Why It Matters:
- Prevents “works on my laptop” bugs for architecture.
- Maintains consistency between builds, teams, and environments.
- Rebuilding diagrams becomes automated (such as testing or linting).
Example:
You can use a tool like PlantUML in a CI pipeline to regenerate architecture diagrams every time the diagram source file changes.
java -jar plantuml.jar system_diagram.puml
This command can be automated to run whenever code is pushed.
3-) Integration with Developer Workflows
The best tools are the ones that fit naturally into existing development pipelines. Diagrams as code work well with:
- Version control systems (e.g., Git)
- CI/CD pipelines (e.g., GitLab, GitHub Actions)
- Documentation systems (e.g., Markdown, MkDocs, Docusaurus)
- Code reviews (PRs and merge requests)
Why It Matters:
- Encourages keeping diagrams up-to-date.
- Reduces friction between documentation and actual implementation.
- Makes visual documentation a first-class citizen in the dev lifecycle.
Example:
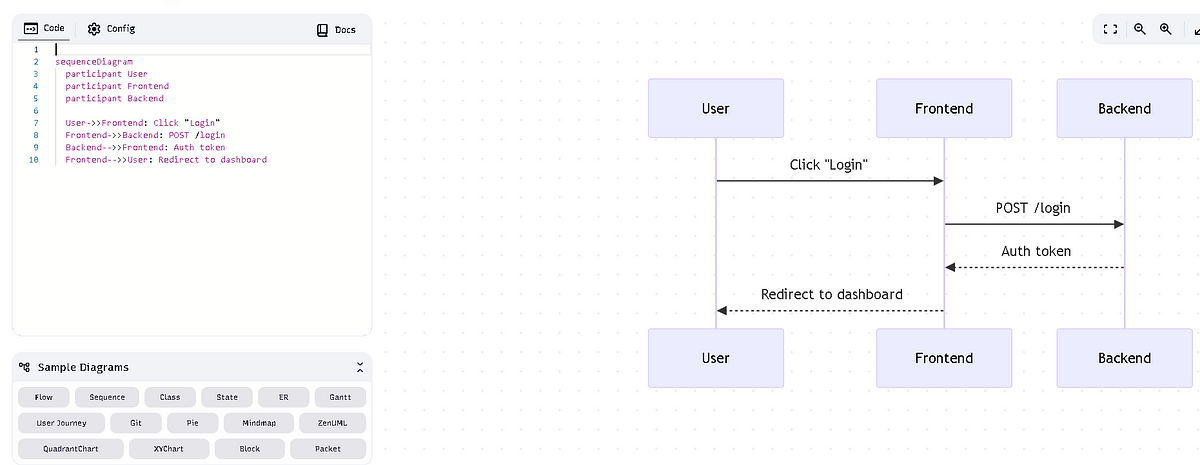
A DevOps team could include a Mermaid diagram in the README of a repo, which automatically updates on each deployment. Markdown rendering engines will display the latest architecture state without extra effort.
sequenceDiagram
  participant User
  participant Frontend
  participant Backend

  User->>Frontend: Click "Login"
  Frontend->>Backend: POST /login
  Backend-->>Frontend: Auth token
  Frontend-->>User: Redirect to dashboard
4-) Modularity and Scalability
Equally in code, breaking diagrams into small, composable pieces increases clarity and ease of maintenance. Instead of having to draw a large, intimidating system diagram, it is better to modularize by:
- Scope (Context → Container → Component — in the C4 model)
- Service or module
- Environment (dev, staging, prod)
Why It Matters
- Easier to keep diagrams up to date as systems evolve.
- Ensures clean separation of concerns.
- Eases reuse across documents or tools.
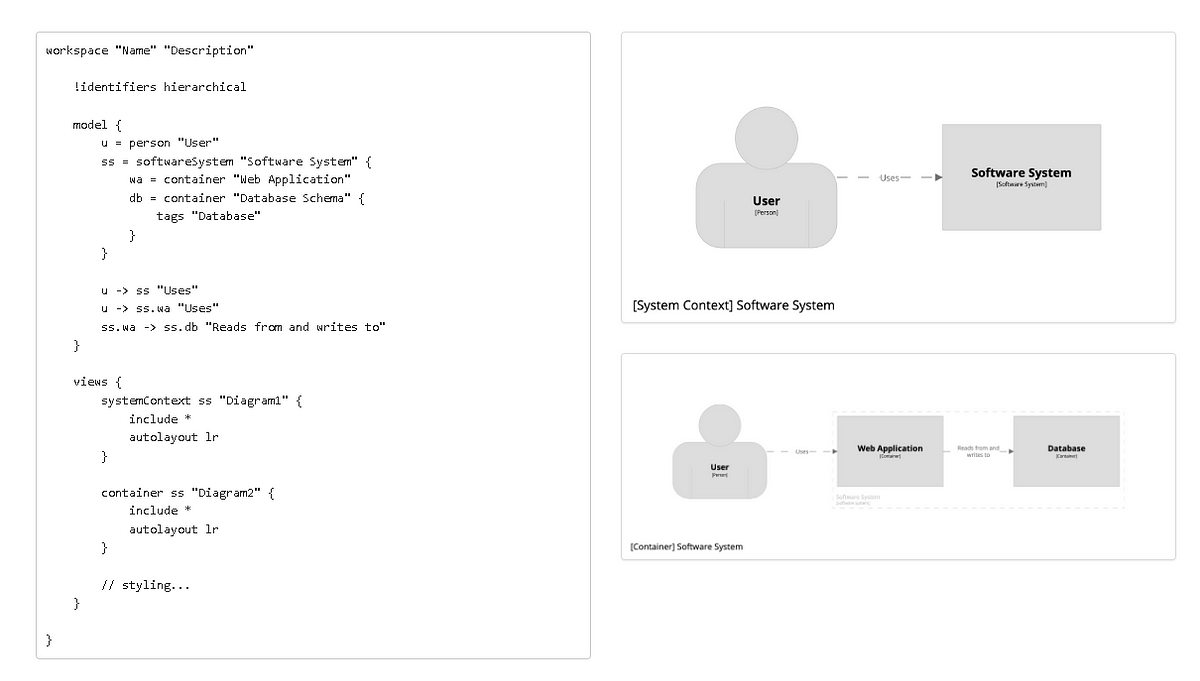
Example:
With Structurizr, you are able to define multiple views of the same computer system — a
business stakeholder view (high-level context), a developer view (in-depth components).
Popular Tools for Architecture as Code
For architecture, as code, we can use different tools, such as:
𝟭. 𝗦𝘁𝗿𝘂𝗰𝘁𝘂𝗿𝗶𝘇𝗿: Create multiple
diagrams from a single (C4) model.
https://structurizr.com/
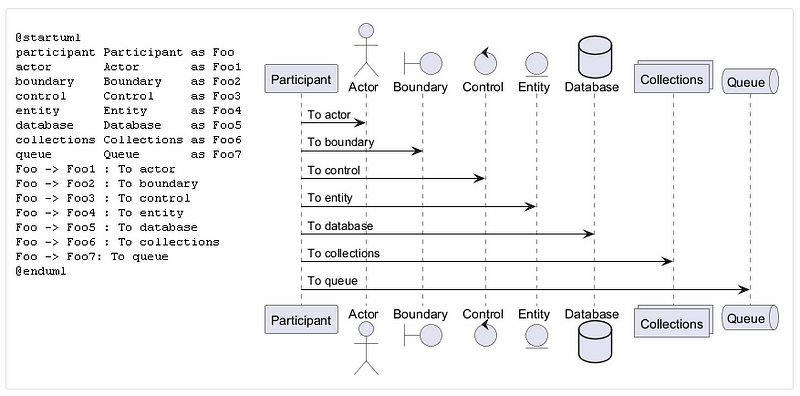
𝟮. 𝗣𝗹𝗮𝗻𝘁𝗨𝗠𝗟: It is an open-source tool that allows users to create diagrams from a plain text language. https://github.com/plantuml/plantuml
𝟯. 𝗗𝗶𝗮𝗴𝗿𝗮𝗺𝘀: Turn Python code into cloud system architecture diagrams. https://github.com/mingrammer/diagrams
𝟰. 𝗠𝗲𝗿𝗺𝗮𝗶𝗱: Generation of diagram and flowchart from a text similar to Markdown. https://github.com/mermaid-js/mermaid
𝟱. 𝗔𝗦𝗖𝗜𝗜 𝗲𝗱𝗶𝘁𝗼𝗿: Free editor for drawing ASCII diagrams. https://asciiflow.com/
𝟲. 𝗠𝗮𝗿𝗸𝗺𝗮𝗽: Could you visualize your Markdown as mind maps? It supports the VS code plugin. https://markmap.js.org/
𝟳. 𝗚𝗼 𝗱𝗶𝗮𝗴𝗿𝗮𝗺𝘀: Create system diagrams with Go. https://github.com/blushft/go-diagrams
𝟴. 𝗦𝗲𝗾𝘂𝗲𝗻𝗰𝗲𝗗𝗶𝗮𝗴𝗿𝗮𝗺.𝗼𝗿𝗴: You can create your UML sequence diagrams online using text notation. https://sequencediagram.org/
Tool Comparison
When selecting a diagrams as code tool, the best choice depends on your team’s tech stack, diagramming needs, and workflow preferences. Below is a comparison of the most widely used tools.
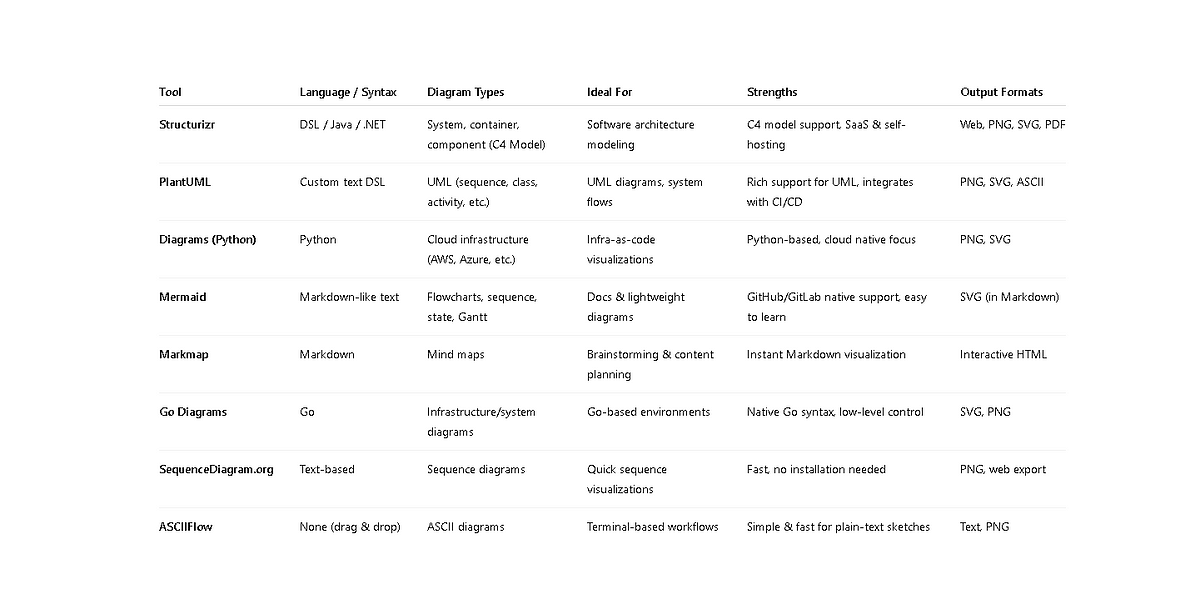
Tool Highlights by Use Case
1-) For Software Architecture Diagrams
- Structurizr — Best for C4 modeling and layered system views.
- PlantUML — Flexible, great for technical architecture and logic modeling.
2-) For Documentation in Git Repos
- Mermaid — Works inside Markdown, GitHub/GitLab compatible.
- Markmap — Converts Markdown lists into mind maps, great for planning.
3-) For Cloud Infrastructure Diagrams
- Diagrams (Python) — Define cloud environments visually using code.
- Go Diagrams — Ideal if you prefer Go or need tight code integration.
4-) For Quick Sketches and Simplicity
- ASCIIFlow — No setup, great for terminal diagrams.
- SequenceDiagram.org — Minimal UI, fast diagram creation online.
Real-World Use Cases
Adopting Architecture as Code goes beyond choosing tools — it’s about integrating them into your workflow. Here are real-world use cases showing how organizations and teams use these tools to improve documentation, collaboration, automation, and development speed.
1-) For Software Architecture Diagrams
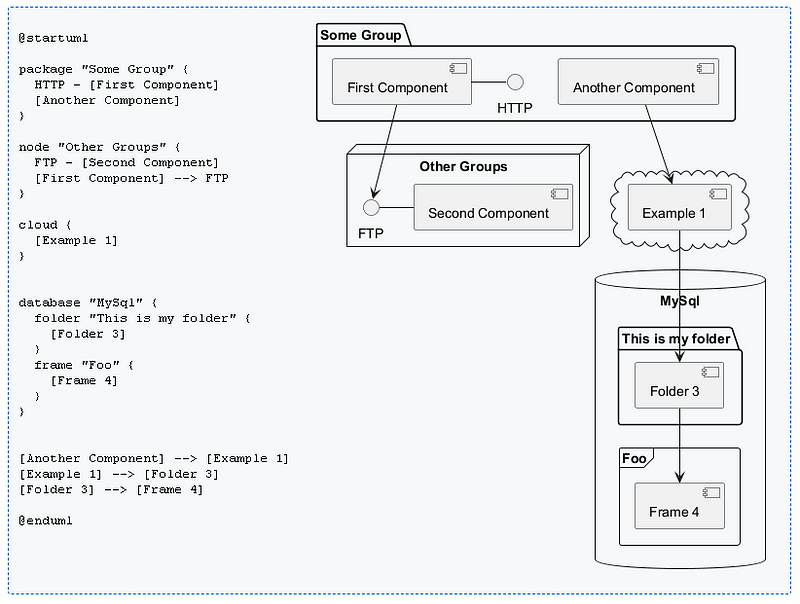
You can try online Plantuml online
editor.
https://www.plantuml.com/plantuml/uml/SyfFKj2rKt3CoKnELR1Io4ZDoSa70000
@startuml

package "Some Group" {
  HTTP - [First Component]
  [Another Component]
}

node "Other Groups" {
  FTP - [Second Component]
  [First Component] --> FTP
}

cloud {
  [Example 1]
}


database "MySql" {
  folder "This is my folder" {
    [Folder 3]
  }
  frame "Foo" {
    [Frame 4]
  }
}


[Another Component] --> [Example 1]
[Example 1] --> [Folder 3]
[Folder 3] --> [Frame 4]

@enduml
2-) For Documentation in Git Repos
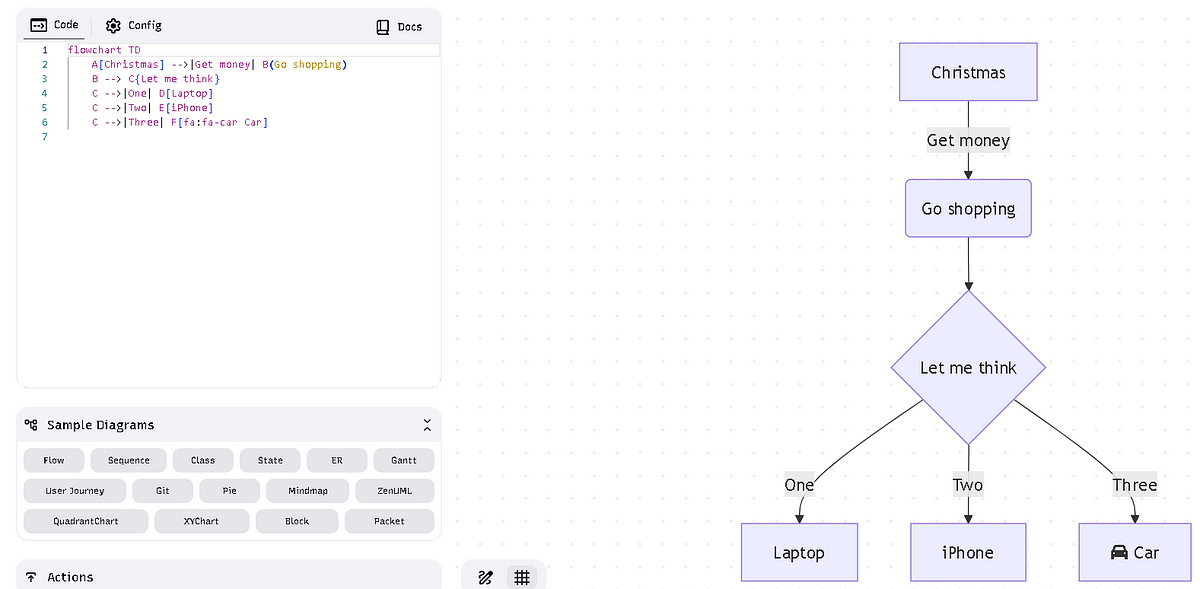
You can try online editor https://mermaid.live/
flowchart TD
    A[Christmas] -->|Get money| B(Go shopping)
    B --> C{Let me think}
    C -->|One| D[Laptop]
    C -->|Two| E[iPhone]
    C -->|Three| F[fa:fa-car Car]
3-) For Cloud Infrastructure Diagrams
- Python Diagram — Turn Python code into cloud system architecture diagrams. https://github.com/mingrammer/diagrams
from diagrams import Cluster, Diagram, Edge
from diagrams.onprem.analytics import Spark
from diagrams.onprem.compute import Server
from diagrams.onprem.database import PostgreSQL
from diagrams.onprem.inmemory import Redis
from diagrams.onprem.aggregator import Fluentd
from diagrams.onprem.monitoring import Grafana, Prometheus
from diagrams.onprem.network import Nginx
from diagrams.onprem.queue import Kafka

with Diagram(name="Advanced Web Service with On-Premises (colored)", show=False):
    ingress = Nginx("ingress")

    metrics = Prometheus("metric")
    metrics << Edge(color="firebrick", style="dashed") << Grafana("monitoring")

    with Cluster("Service Cluster"):
        grpcsvc = [
            Server("grpc1"),
            Server("grpc2"),
            Server("grpc3")]

    with Cluster("Sessions HA"):
        primary = Redis("session")
        primary \
            - Edge(color="brown", style="dashed") \
            - Redis("replica") \
            << Edge(label="collect") \
            << metrics
        grpcsvc >> Edge(color="brown") >> primary

    with Cluster("Database HA"):
        primary = PostgreSQL("users")
        primary \
            - Edge(color="brown", style="dotted") \
            - PostgreSQL("replica") \
            << Edge(label="collect") \
            << metrics
        grpcsvc >> Edge(color="black") >> primary

    aggregator = Fluentd("logging")
    aggregator \
        >> Edge(label="parse") \
        >> Kafka("stream") \
        >> Edge(color="black", style="bold") \
        >> Spark("analytics")

    ingress \
        >> Edge(color="darkgreen") \
        << grpcsvc \
        >> Edge(color="darkorange") \
        >> aggregator
Output is
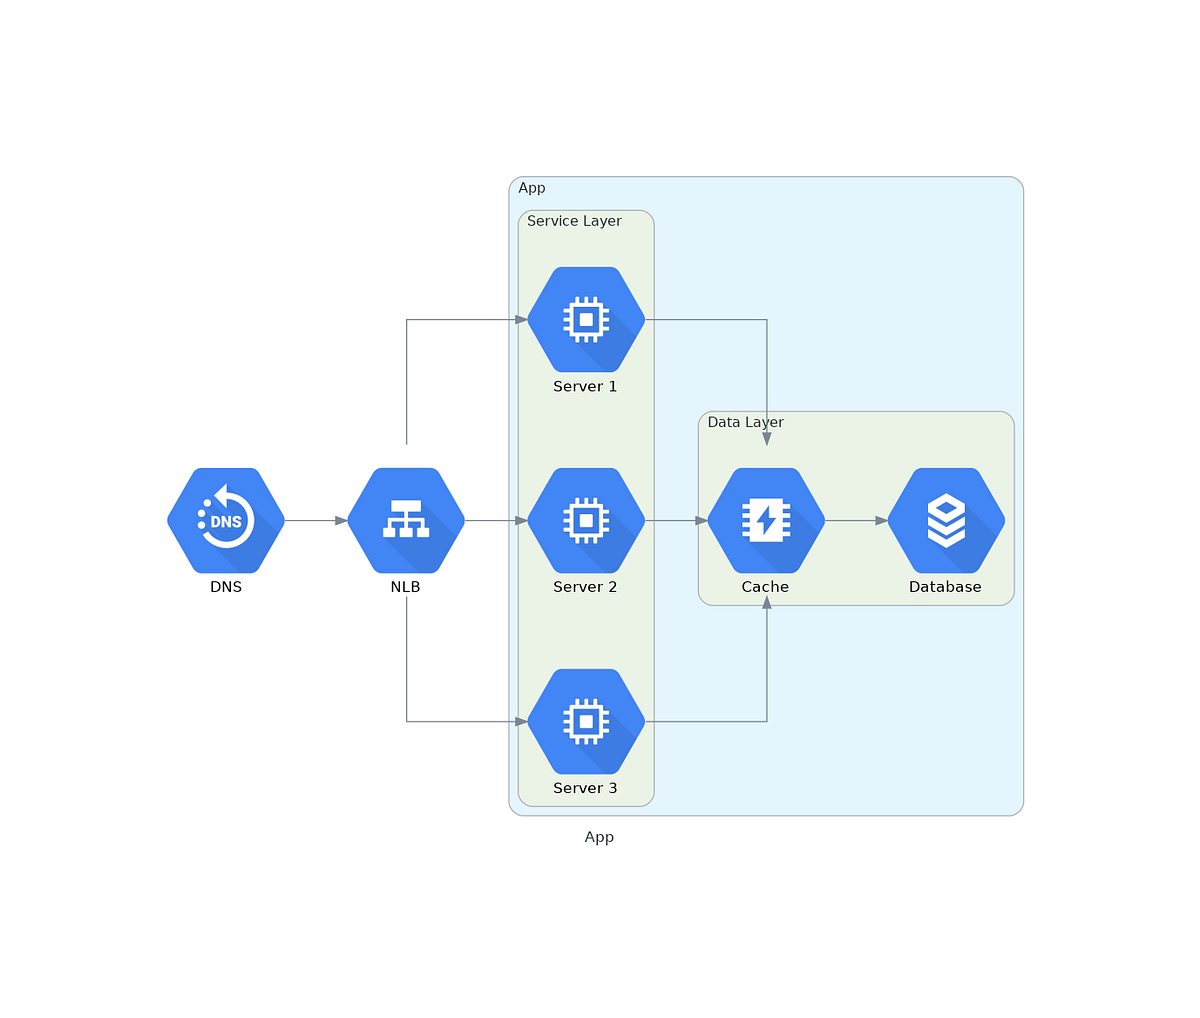
- Go Diagram — Create system diagrams with Go. https://github.com/blushft/go-diagrams
d, err := diagram.New(diagram.Filename("app"), diagram.Label("App"), diagram.Direction("LR"))
if err != nil {
    log.Fatal(err)
}

dns := gcp.Network.Dns(diagram.NodeLabel("DNS"))
lb := gcp.Network.LoadBalancing(diagram.NodeLabel("NLB"))
cache := gcp.Database.Memorystore(diagram.NodeLabel("Cache"))
db := gcp.Database.Sql(diagram.NodeLabel("Database"))

dc := diagram.NewGroup("GCP")
dc.NewGroup("services").
    Label("Service Layer").
    Add(
        gcp.Compute.ComputeEngine(diagram.NodeLabel("Server 1")),
        gcp.Compute.ComputeEngine(diagram.NodeLabel("Server 2")),
        gcp.Compute.ComputeEngine(diagram.NodeLabel("Server 3")),
    ).
    ConnectAllFrom(lb.ID(), diagram.Forward()).
    ConnectAllTo(cache.ID(), diagram.Forward())

dc.NewGroup("data").Label("Data Layer").Add(cache, db).Connect(cache, db)

d.Connect(dns, lb, diagram.Forward()).Group(dc)

if err := d.Render(); err != nil {
    log.Fatal(err)
}
output is
4-) For Quick Sketches and Simplicity
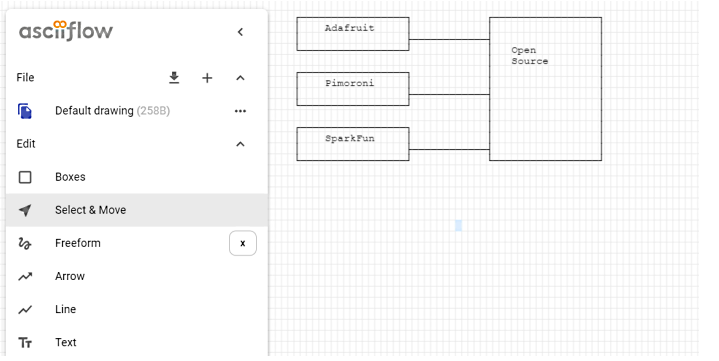
- ASCIIFlow — No setup, great for terminal diagrams. https://asciiflow.com/
Making a conclusion
👨👦👦 Leave a comment, I am free for discussion with your any kind technical question.
#ArchitectureAsCode #SoftwareArchitecture #DevOps #InfrastructureAsCode #CloudArchitecture #VersionControl #Automation #Scalability #Microservices #TechDocumentation #Mermaid #Plantuml